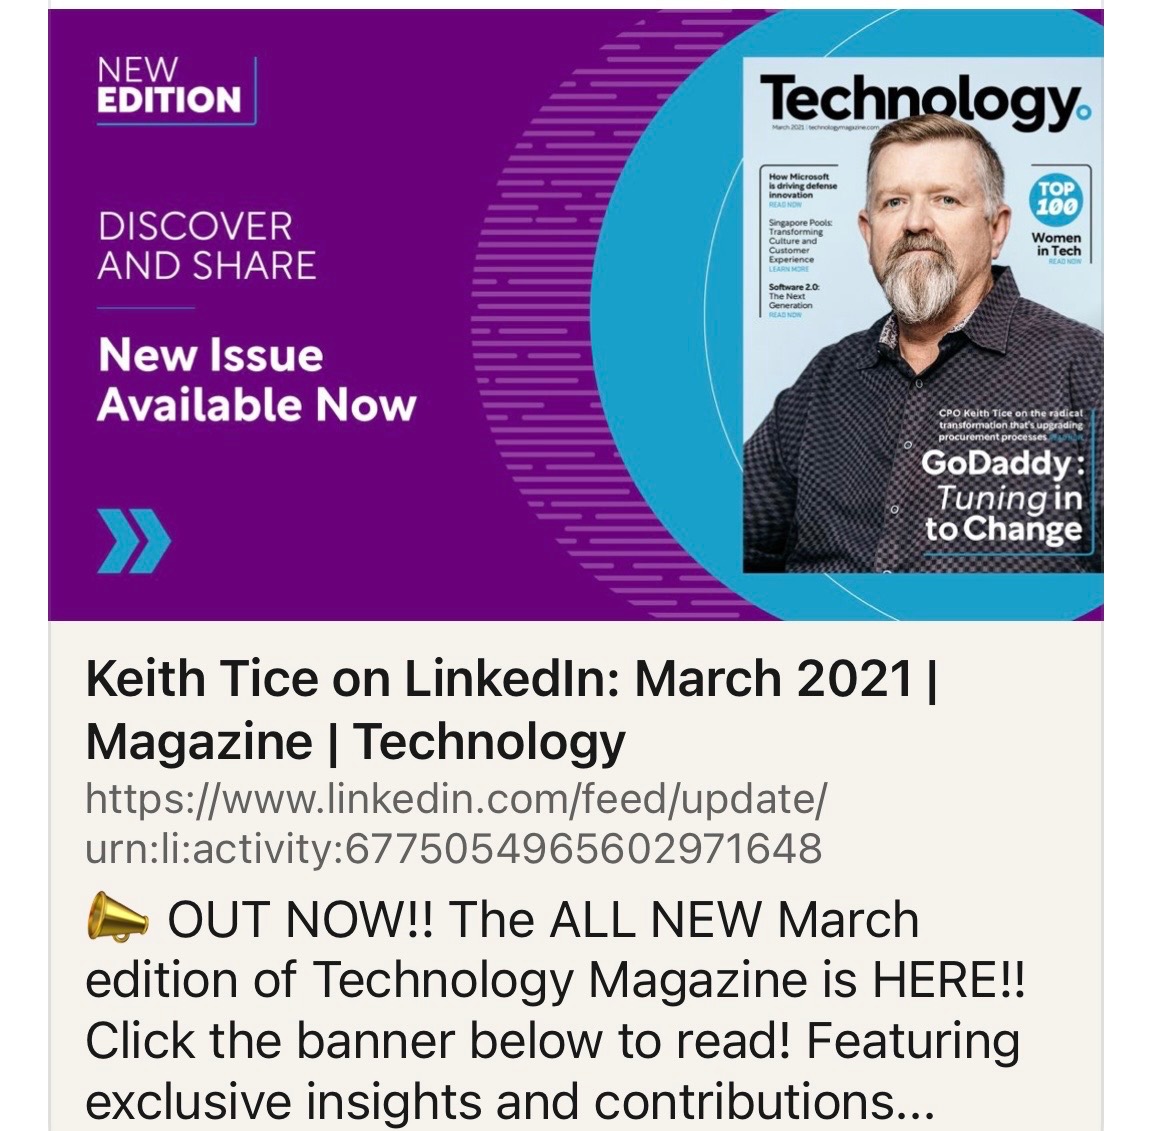
Featured In
Technology Magazine
GoDaddy: Tuning in to Change
Peer benchmarks are drawn from direct engagement experience — not a survey database.
Executive Diagnostic
Operational Maturity
Assessment™
A structured executive diagnostic for growth-stage, SaaS, technology, PE-backed, and transformation-focused organizations seeking to understand where operations support scale — and where they create risk, friction, or missed value.
Built by an operator who has been in the seat — not a consulting framework applied from the outside. Keith Tice spent 13+ years as CPO and Enterprise Operations Executive at GoDaddy, personally leading or overseeing 50+ acquisition integrations across global enterprise operations.
The Operational Maturity Assessment™ evaluates the operational foundations that determine whether an organization can scale, integrate acquisitions, improve governance, reduce value leakage, strengthen commercial discipline, and mature from tactical execution to enterprise-level operational leadership.
This is not a generic survey. It is designed to identify operational gaps, governance weaknesses, scalability constraints, supplier and spend risks, commercial leakage, and areas where executive advisory support may create measurable enterprise value.
Assessment requests are reviewed for fit. When there is alignment, Keith Tice Advisory, LLC may provide an Executive Snapshot or recommend a deeper Operational Maturity Assessment™.
Who It Is For
Built for Organizations at an Inflection Point
Organizations Preparing for Exit
Operational maturity gaps discovered in diligence compress multiples. An independent assessment 12–18 months before a process gives leadership time to close the gaps that matter — governance, spend visibility, supplier risk, data integrity, and scalability. Buyers scrutinize all of it.
PE-Backed Businesses
Value creation requires operational maturity — not just financial engineering. EBITDA improvement starts with operational discipline. Portfolio companies that close maturity gaps faster create more value, faster.
M&A Integration Teams
Synergy realization is almost always an operational problem. Pre-close diligence and post-close integration require structured operational leadership — not just a project plan.
Growth-Stage Companies
Scaling faster than operational infrastructure can support — governance, process, and team structure need to catch up before the gaps become expensive.
SaaS & Technology Organizations
Vendor sprawl, tool proliferation, and spend opacity accumulate during hypergrowth. Operational discipline becomes a competitive advantage when peers are still firefighting.
Transformation-Focused Leaders
Enterprise transformation requires operational foundations — governance, accountability, and execution discipline that survive reality, not just the slide deck.
Assessment Options
Two Paths to Clarity
Option 1
Executive Snapshot
A shorter initial intake designed to identify broad maturity indicators and determine whether a deeper assessment would be valuable. Appropriate for organizations exploring fit or early in their operational improvement journey.
Option 2
Full Operational Maturity Assessment™
A detailed diagnostic covering enterprise operating model, procurement maturity, spend visibility and data integrity, vendor management and supplier categorization, tail spend and spend concentration, supplier ecosystem, commercial discipline, M&A integration readiness, real estate and facilities strategy, people and workforce structure, outsourced services performance, finance alignment, forecasting, budgeting discipline, and growth accounting — across all 31 domains. Data and analytics domains are weighted higher in the OMI™ score.
How the OMI™ Score Is Calculated
Most maturity models use a flat average. The Operational Maturity Index™ uses a weighted formula: Σ(score × weight) / Σ(weight). Data visibility and analytics domains carry 2× weight. Governance and finance-critical domains carry 1.5× weight. Standard domains carry 1× weight.
The weighting reflects a deliberate point of view: without reliable data, every downstream process — forecasting, supplier management, spend analytics, ROI tracking — is built on an unreliable foundation. Data integrity is not one domain among many. It is the foundation that determines whether every other domain score is trustworthy.
Assessment Domains
31 Domains of Operational Maturity
Each domain is evaluated independently and contributes to the weighted Operational Maturity Index™. Data visibility and analytics domains carry elevated weight — without reliable data, every downstream process is compromised.
Enterprise Governance & Operating Model
Reporting structure, authority levels, decision rights, governance forums, policy ownership, and whether operational teams have a meaningful seat at the table.
Procurement vs. Purchasing Maturity
Assess the difference between transactional purchasing and strategic procurement — spend management, supplier governance, category strategy, and enterprise alignment.
Spend Visibility & Analytics
Spend coverage, addressable spend, classification, analytics tools, ERP usage, data quality, reporting cadence, and whether leadership has reliable visibility into enterprise spend.
Technology, ERP & Tool Usage
ERP systems, procurement tools, contract lifecycle management, spend analytics platforms, automation, AI usage, and depth of tool adoption versus tool ownership only.
Commercial & Financial Discipline
Payment terms, discount capture, working capital, value tracking, cost reduction methodology, budget alignment, PPV, and commercial decision-making authority.
Supplier & Vendor Ecosystem
Supplier count, vendor rationalization, single-source risk, supplier concentration, strategic segmentation, scorecards, performance management, and partnership agreements.
Contracts, Legal & Risk
Contract ownership, repositories, renewal management, risk review, outsourcing agreements, audit findings, compliance gaps, and procurement involvement in commercial decisions.
Inventory & Supply Chain
Inventory ownership, excess/obsolete inventory, forecasting, safety stock, vendor-managed inventory, supply continuity, and inventory-related working capital opportunities.
Team, Talent & Structure
Team size, structure, locations, global coverage, category expertise, leadership development, succession planning, and whether the team is built to support scale.
Governance, Policy & Decision Authority
Procurement policies, spend authority matrix, decision rights, approval workflows, business involvement, executive escalation paths, and whether governance enables speed.
Category Management & Market Intelligence
Category strategy, market intelligence, supplier market knowledge, negotiation preparation, competitive benchmarking, demand management, and category ownership maturity.
M&A Integration & Redundancy Elimination
Procurement involvement in M&A, pre-close diligence, contract review, synergy identification, integration playbooks, vendor and headcount harmonization, location consolidation, and post-close value tracking.
Reporting, Measurement & Value Creation
How operational teams are measured — cost savings, cost avoidance, value creation, payment terms, working capital, risk reduction, and operational scalability.
Audit, Controls & Compliance
Audit findings, procurement-related control weaknesses, policy compliance, contract risk, and unresolved governance gaps where operational maturity can reduce exposure.
Strategic Influence
Whether procurement and operational leadership have a seat at the table — involved in business strategy, M&A, budgeting, forecasting, and enterprise transformation.
Procurement Tool Investment vs. Expense Framing
How the organization views procurement technology spend — as a cost line or a value-generating investment. ROI tracking on tool spend, adoption measurement, and whether finance and operations are aligned on the investment thesis.
Procurement Measurement & Performance Metrics
How procurement is measured: cost savings, cost avoidance, PPV, payment terms improvement, working capital contribution, supplier performance scores, cycle time, PO compliance, contract coverage, and spend under management as a percentage of addressable spend.
Real Estate, Facilities & Location Strategy
Owned vs. leased footprint, lease terms and renewal exposure, rent benchmarking, co-location and consolidation opportunities, location rationalization post-M&A, redundant facilities, make vs. buy on facilities management, and whether real estate decisions are driven by strategy or inertia.
People, Workforce & Operational Redundancy
Headcount by function and location, span of control, role duplication across business units or acquired entities, outsourced vs. insourced labor decisions, workforce cost as a percentage of revenue, and whether people decisions are driven by operational design or historical structure.
Outsourced Services Assessment & Vendor Performance
Inventory of all outsourced services (IT, HR, finance, facilities, logistics, customer support, legal, marketing), performance against SLAs, cost benchmarking, make vs. buy analysis, contract terms, and whether outsourcing decisions are reviewed on a defined cycle.
Tax Management & Structural Efficiency
Tax strategy alignment with operational structure, transfer pricing, entity rationalization, tax implications of M&A integration, depreciation strategy, R&D credits, and whether finance and operations are coordinated on tax-impacting decisions.
NDA, JDA & Confidentiality Agreement Management
Volume and tracking of NDAs and joint development agreements, ownership of the NDA process, renewal and expiration management, standard vs. negotiated terms, legal involvement thresholds, and whether confidentiality obligations are actively monitored.
Depreciation Cycles & Asset Management
Asset register completeness, depreciation schedule alignment with actual useful life, refresh cycle discipline, capex vs. opex decision framework, technology asset lifecycle management, and whether depreciation assumptions are reviewed against operational reality.
ROI Discipline & Investment Decision Frameworks
Whether the organization applies consistent ROI methodology to capital and operational investments, how hurdle rates are set, post-investment performance tracking, and whether finance and operations jointly own investment outcomes.
Finance Alignment & Operational Partnership
The quality of the relationship between finance and operations — joint forecasting, shared accountability for budget performance, finance involvement in operational decisions, and whether finance is a strategic partner or a reporting function.
Forecasting Maturity & Accuracy
Forecasting methodology, cadence, accuracy tracking, driver-based vs. historical models, rolling forecast adoption, scenario planning, and whether operational leaders own forecast inputs or delegate them to finance.
Budgeting Discipline — Line-Item vs. Bucket Approach
Whether the organization budgets at the line-item level or in spend buckets, the granularity of budget ownership, zero-based vs. incremental budgeting, budget vs. actual variance analysis, and whether budget accountability is embedded in operational leadership.
Growth Accounting vs. Budget Management
How the organization distinguishes between growth investment and operational cost, whether growth spend is tracked separately from run-rate, accountability for growth ROI, and whether budget management processes are designed for a scaling business or a steady-state one.
Vendor Management & Supplier Categorization
How vendors are segmented and managed — core/strategic vs. leverage vs. tail vs. commodity. Supplier categorization methodology, business involvement in negotiations, vendor meeting formats and cadence, who attends and why, meeting structure and location, and whether vendor relationships are managed as partnerships or transactions.
Spend Analytics, Concentration & Tail Spend
Total vendor count vs. total spend, top 80% spend concentration (Pareto analysis), addressable spend identification, tail spend management strategy, spend by category and business unit, year-over-year spend trending, and whether analytics are used to drive decisions or simply report history.
Data Integrity & Operational Data Quality
The accuracy, completeness, and reliability of operational data across ERP, procurement, finance, and HR systems. Master data governance, duplicate vendor records, data classification consistency, reporting data vs. source-of-truth alignment, and whether leadership can trust the numbers they are making decisions on.
Scoring Model
Operational Maturity Index™
Seven maturity levels provide a precise, honest picture of where an organization stands — and what it takes to advance.
Peer benchmarks are drawn from Keith’s direct engagement experience across 50+ acquisitions and 13+ years of enterprise operations leadership — not a third-party survey database. They reflect what organizations at similar scale and stage actually look like, not what they report.
Assessment Output
What Leadership Receives
Assessment output is designed for executive review — practical, direct, and actionable. Not a generic report. A structured perspective on where the organization stands and where it needs to go.
Delivery Format
A written executive report with domain scoring, peer benchmarks, Keith’s commentary on each finding, a prioritized roadmap, and a follow-on conversation to walk through findings and answer questions. Delivered within 5–7 business days of intake review.
- Weighted Operational Maturity Index™ score across all 31 domains
- Operational heat map — domain-by-domain scoring with peer benchmarks
- Top maturity gaps and priority observations, ranked by impact
- Top value creation opportunities with effort/impact classification
- Governance risks and scalability constraints
- Spend visibility, data integrity, and analytics findings
- Vendor categorization and supplier ecosystem assessment
- Tail spend and spend concentration analysis
- Real estate, facilities, and location strategy observations
- People, workforce, and redundancy findings
- Outsourced services performance and make vs. buy assessment
- Finance alignment and forecasting maturity
- Budgeting discipline and growth accounting observations
- M&A readiness and integration capability assessment
- Prioritized 18-month roadmap — phased by effort and impact
- Areas where Keith Tice Advisory, LLC may be able to help
Important
The Operational Maturity Assessment™ is not a self-service tool. Assessment requests are reviewed for fit.
When there is alignment, Keith Tice Advisory, LLC may provide an Executive Snapshot or recommend a deeper Operational Maturity Assessment™. Engagements are selective by design.
“Strategy rarely fails on paper. Operations determine whether it survives reality.”
— Keith Tice
Request Assessment
Request the Operational Maturity Assessment™
For organizations ready to understand where operational maturity can unlock scale, governance, efficiency, and enterprise value. Complete the intake below — all requests are reviewed personally.
Submit Intake
Complete the form below. All fields inform the assessment — the more context, the sharper the output.
Keith Reviews
Every request is reviewed personally within 2–3 business days. You will hear back directly if there is alignment.
Report Delivered
Written executive report with domain scoring, commentary, roadmap, and a follow-on conversation. Delivered within 5–7 business days of intake review.
Ready to Understand Where You Stand?
For organizations ready to understand where operational maturity can unlock scale, governance, efficiency, and enterprise value.